A scientific mystery meets machine learning
What if you were handed an unknown molecule and asked to figure out its structure?
Not just which atoms it contains, but how those atoms are connected. And what if your only clues came from measurements of how that molecule breaks apart?
That’s the challenge that drew me to the Enveda CASMI 2026 competition on Kaggle, where participants develop computational methods to identify molecular structures using mass spectrometry data.
I joined because I’ve been wanting to learn machine learning by actually doing it. Not just asking an AI system to solve problems, but understanding how models are built, trained, tested, and improved.
There’s just one complication.
I’m not a chemist. And when I started, I knew very little about mass spectrometry.
So my first task wasn’t training an AI model. It was figuring out what the data meant.
Reading the fingerprints of molecules
Mass spectrometry is a scientific technique used to study molecules by measuring electrically charged particles called ions.
In tandem mass spectrometry, or MS/MS, selected ions are broken into smaller pieces called fragments. An instrument measures the mass-to-charge ratios of the resulting ions and records their signal intensities.
The result is a mass spectrum, a graph filled with vertical peaks. Each peak represents a detected ion signal at a particular mass-to-charge ratio, abbreviated m/z. The height indicates its relative intensity.
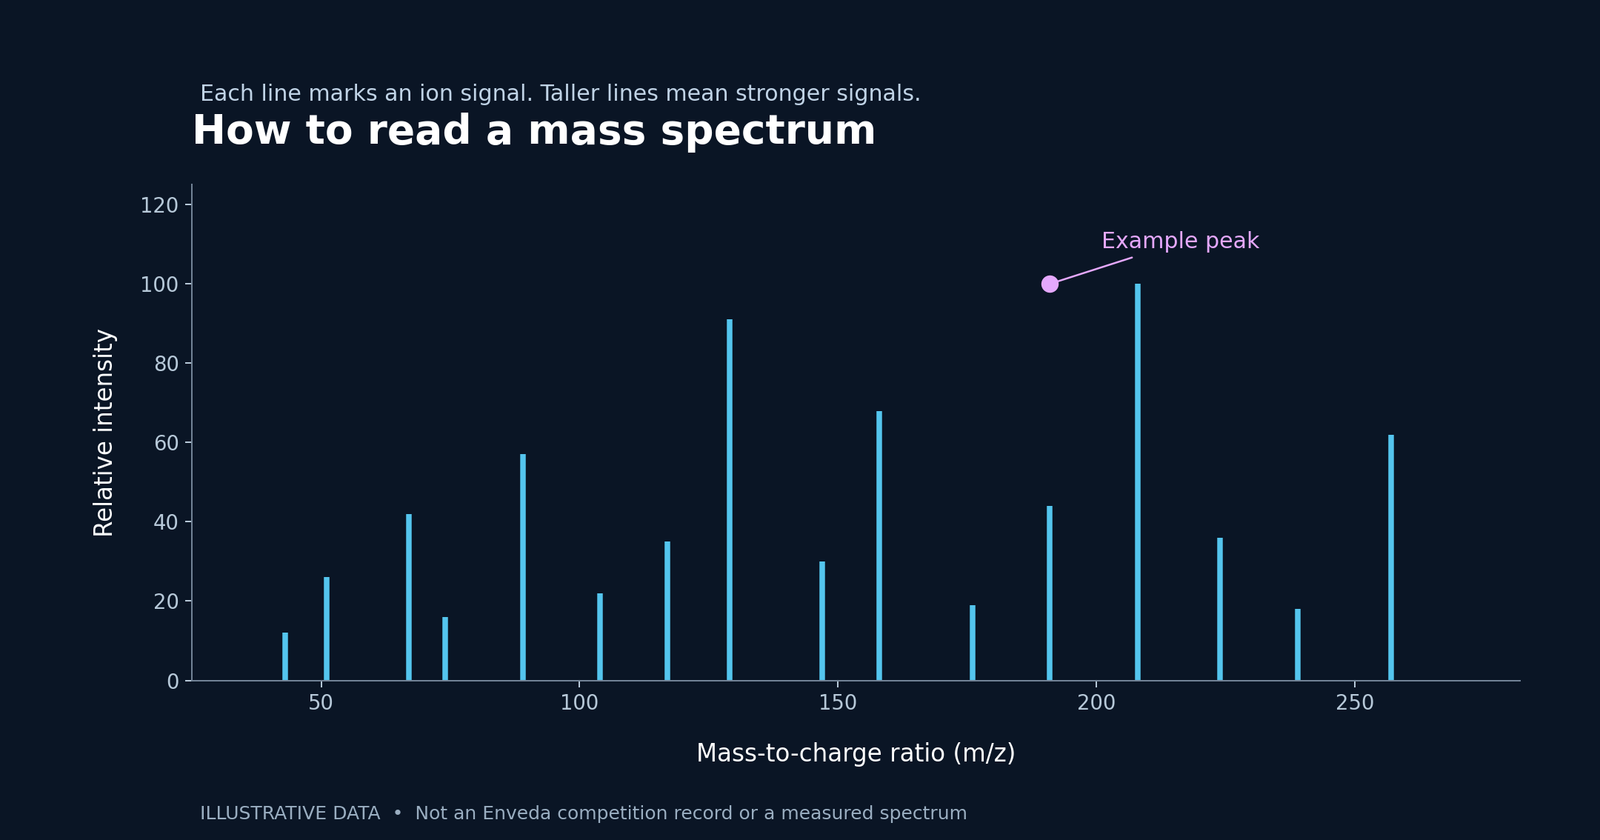
Different molecules can produce different fragmentation patterns, providing clues about their structures. And here’s what I find fascinating: the instrument doesn’t simply take a picture of the molecule.
Instead, scientists reconstruct information about its possible structure by interpreting the evidence left behind.
That makes molecular identification an interesting machine learning problem. If a computer can learn relationships between molecular structures and spectral patterns, could it help identify molecules it hasn’t encountered before?
My first look at real scientific data
I began working in a Kaggle notebook using Python, loading the competition’s training and test datasets. My first goal was to understand the information in front of me.
I explored molecular formulas, chemical structures represented as SMILES strings, precursor ions, collision energies, and lists of spectral peaks.
I plotted a spectrum using Python and started asking questions. Why are some peaks much taller than others? What causes a molecule to fragment in particular ways? Why are some peaks close to the precursor mass?
These questions led me into isotopes, chemical bonding, ionization, and fragmentation.
I also began investigating something called neutral loss. When a molecular ion fragments, it can lose a piece that carries no electrical charge. Because the mass spectrometer detects ions, the neutral piece isn’t directly visible as a peak.
Comparing precursor and fragment measurements, with charge and ion composition properly accounted for, can provide clues about the neutral material that was lost. I started calculating these differences and exploring what they might reveal about molecular structure.
Caffeine offers a useful public example. See its molecular structure on Wikimedia Commons and a real caffeine spectrum from NIST. These are independent examples, not competition data; the NIST example need not use the same measurement method as the competition.
Finding patterns: my first aha moment
After examining individual spectra, I moved into comparing spectra against one another. I explored similarity results that ranked other spectra according to how closely their peak patterns resembled a selected example.
At first, I completely misunderstood what I was looking at. I saw numbered rows and similarity values and thought they might represent individual mass bins or the frequency of particular signals.
Then something clicked.
I wasn’t looking at which mass had the most signals. I was looking at which other spectrum most closely resembled the spectrum I’d selected.
That distinction changed how I understood the results.
If two spectra have similar patterns, perhaps their molecules share structural features. But similarity isn’t proof that two molecules are identical. Different compounds can produce overlapping fragments, and experimental conditions can change spectral patterns.
This is the kind of problem that makes machine learning interesting: identifying meaningful relationships while learning to distinguish useful evidence from misleading similarities.
Calculating spectral similarity is not the same thing as training a machine learning model. At this stage, I’m exploring the data and learning how to interpret computational comparisons.
The challenges I’m discovering
One thing I’ve learned already is that working with scientific data requires understanding what the measurements actually represent.
For example, mass spectrometry measures mass-to-charge ratio, not simply molecular mass. To interpret the data correctly, I need to understand electrical charge, adducts, and how a molecule’s measured form may differ from its neutral form.
Then there’s the machine learning side. How should I represent hundreds of spectral peaks as input to a model? How do I account for differences in collision energy? How can I tell whether an apparent pattern is meaningful or coincidental?
And perhaps most importantly, how do I know whether a model has actually learned something useful rather than simply recognizing examples it has already seen?
These aren’t questions I’ve answered yet. They’re questions I’m working toward answering.
From exploration to machine learning
My approach is to build this project in stages. First, I need to understand the scientific measurements and how the competition data is organized.
That’s where I am now: exploring spectra, examining molecular structures, calculating mass differences, and comparing fragmentation patterns.
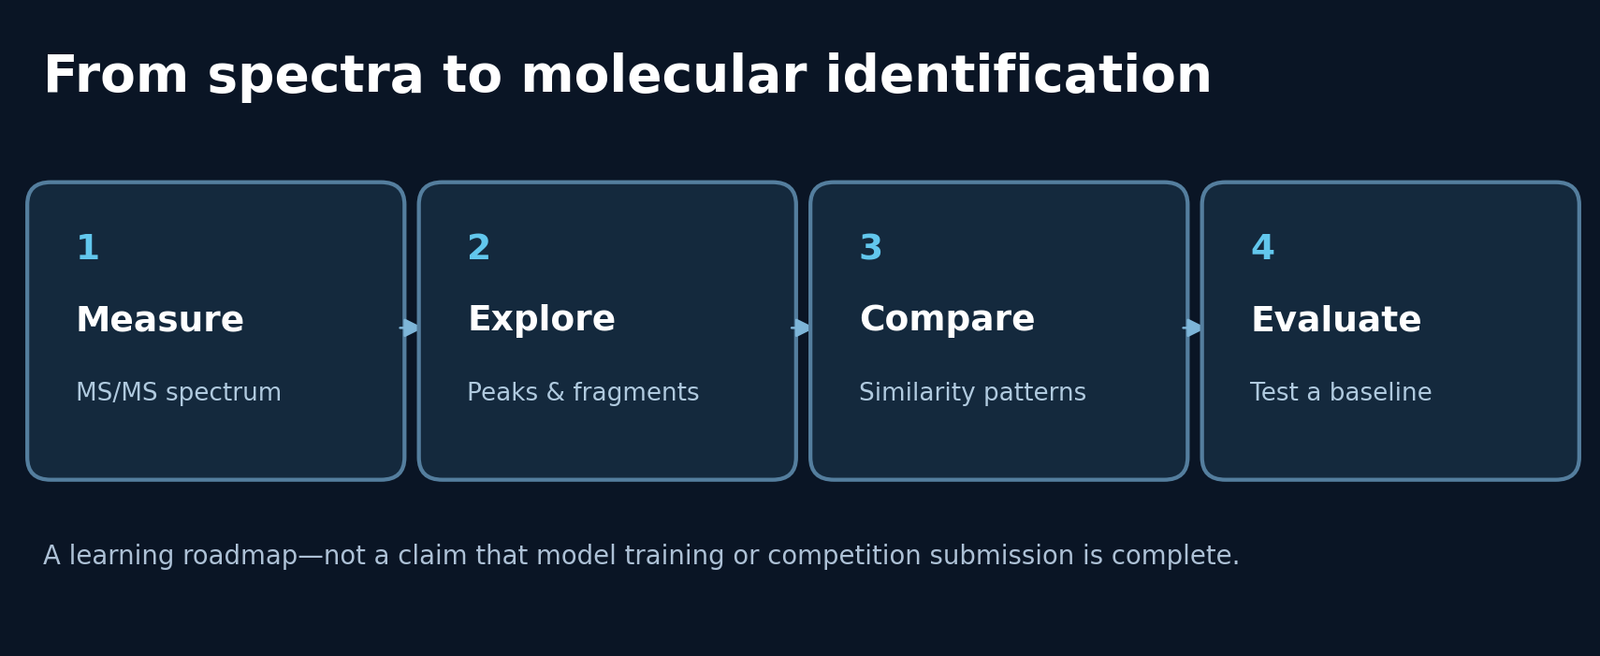
The next step is to establish a simple, reproducible baseline method and evaluate how well it identifies candidate structures.
From there, I want to learn how to prepare data for machine learning, train a model, and validate its predictions using examples held back from development.
Validation is especially important. A model that performs well on familiar examples hasn’t necessarily learned to generalize to new molecules.
Eventually, my goal is to generate predictions for the competition’s test data and evaluate a submission through Kaggle.
I haven’t trained a predictive model or submitted predictions for this competition yet. I’m still building the scientific and technical foundation needed to do that meaningfully.
Learning as I go
What began as a machine learning project has already taken me through atomic structure, isotopes, molecular bonding, mass spectrometry, Python visualization, and computational pattern matching.
And I haven’t even reached model training yet.
That’s one of the things I’m enjoying most about this experience. Every answer seems to uncover another question worth investigating.
I’m not approaching this competition as someone who already knows how to solve the problem. I’m approaching it as someone who wants to understand the science, mathematics, and technology well enough to build and evaluate a solution.
The goal isn’t simply to have AI identify a molecule for me.
It’s to understand how to develop a system that can do it—and how to determine whether it actually works.
That’s what this project, and Nerdsty, is about.
Learning as we go.
Keep exploring
Enveda CASMI 2026 on Kaggle ↗A real caffeine spectrum / NIST ↗Caffeine’s molecular structure / Wikimedia Commons ↗Explore public spectra / MassBank ↗Check individual record licenses before reproducing material from spectral libraries.